Stock Market Rout, Playing the Emotional Game, & Sentiment Feedback Loops
True story: In the first few days of October 2018 my friend Nate asked me over coffee, “Do you think we’re at the top of the market?” Over the course of an hour Nate and I went through the market prognosis in detail. Interest rates were up, housing prices falling, increasing economic uncertainty, and our sentiment indicators were all negative. We both agreed it was the top. We closed our conversation with a mutual reminder - “Time to sell everything.” A few days later the S&P 500 dropped more than 3%, beginning the rout that continues through this week.
But to be clear - I'm no hero. I didn't sell anything.
And I’m not alone in my inertia. Despite what we KNOW to be true intellectually, taking action based on that knowledge is a different beast.
Today’s newsletter examines why it’s difficult for many people to sell at tops and why - based on longer term patterns - the selling may not be over.
IT'S NOT AN INTELLECTUAL GAME
I have various excuses for my inaction in early October - I’m not a market timer, I'm not currently managing money for others, it's not worth my time and attention, etc... All seemed true at the time, yet all these excuses are intellectualizations. I could have saved a pretty paper penny getting out back then. The leap from armchair investor to professional crosses that motivational chasm.
As our MarketPsych colleague Dr. Frank Murtha likes to say, the dieting section of the bookstore is one of the largest. And if one chooses a random dieting book and follows its advice to the letter, most likely they will lose weight. And even without a book, we all know how to lose weight — eat healthy, eat less, move more. Yet almost all dieters fail because they are fighting the wrong battle. We don't lack book knowledge. Fighting off hunger pangs, self-destructive habits, and omnipresent snacks is a battle waged on psychological terrain. It's not won with intellectual firepower.
Even though one may KNOW that declines are coming to financial markets, only a sense of urgency can motivate one to press the sell button. Urgency is a product of emotion. Knowledge alone is not motivating enough to sell (or lose weight). But extreme fear does motivate change (the many post-health-scare vegan converts can attest to that).
THE NEUROSCIENCE OF CALLING THE TOP
To sell at the top, we’ve got to overcome emotional inertia. And based on evidence from neuroeconomics, those who can “feel” the downside risk are more likely to sell before the decline. In a 2014 neuroimaging study performed while subjects traded in an experimental market [https://www.pnas.org/content/111/29/10503], participants with greater Anterior Insula activation at the bubble top (perhaps signaling fear of loss) were more likely to sell and made the most money in the experiment: “High-earning traders have early warning signals in the anterior insular cortex before prices reach a peak, and sell coincidently with that signal, precipitating the crash.” Those who remained rosy and optimistic (signaled by greater ventral striatum / reward system activation) exited too late had lower earnings. (Smith et al, 2014).
Furthermore, there is psychological and behavioral evidence that traders themselves are worse at predicting markets at tops (during booms) than during declines (busts) (Newell and Page, 2017), perhaps contributing to the inertia at tops.
While I intellectualize avoiding market timing, events like the recent rout sow doubt. Yet all the data I've seen indicates timing markets or picking managers is, on average, a losing game for most investors. For example, in MarketPsych research on fifty wealth managers, we found that those who actively manage money have lower overall performance and slower client and AUM growth versus wealth managers who primarily focus on the client relationship. If market timing is not a long-term winning strategy, maybe we should follow the crowd?
GOING WITH THE TREND
“As there are so many people who cannot wait to follow the prevailing trend of opinion, I am not surprised that a small group becomes many. Most people think only of doing what the others do and of following their examples. .. “
~ Josef de la Vega, 1688, “Confusion de las Confusiones," the first book about financial market structure.
In general, the stocks with the most positive references in the media tend to outperform the most negative. The below study examined the performance of US stocks over the period 2006-2018, decile-ranked by their sentiment average on days {-30,0}. The sentiment ranks were tracked over their prior -90 day returns and subsequent +90-day returns. Their decile performance is plotted over those periods. Past price performance correlates with Day 0 sentiment rank. Going forward, the most negative stocks by sentiment rank (blue lines) are also the worst price performers over the next 90 days. The 90+ day subsequent price spread is actionable. That is, the most positive stocks do tend to outperfom the most negative over time.
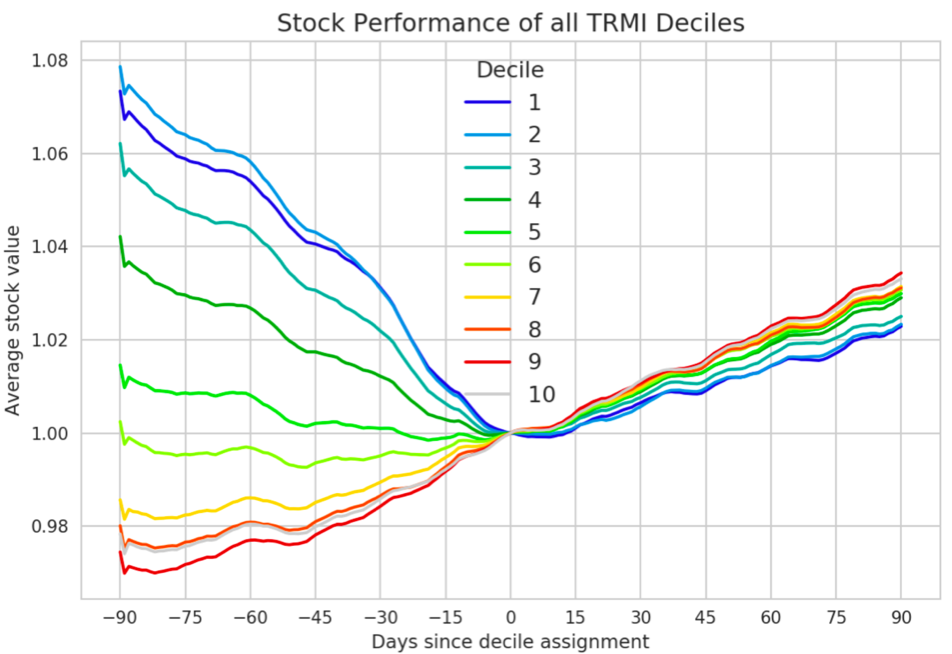
The above research shows sentiment momentum - a phenomenon independent from but similar to price momentum. This research indicates that trends tend to persist over months (and other research we have shows yearly sentiment momentum). So based on this, for individual stocks, following the crowd is helpful. There also appears to be such persistence - positive feedback loops between media sentiment and prices - in large market indexes.
But the above study doesn't take into account when the trade becomes too crowded, or when the sentiment hits an extreme level. From extreme levels of positivity or negativity, the reversals can occur surprisingly fast. When irrational exuberance hits a crescendo, prices are more likely to fall with sentiment leading tem lower, as we described in our last newsletter.
The above study also doesn't refer to overall market sentiment itself. From overall market sentiment we see that at tops, market sentiment falls before prices fall. And when sentiment is falling, prices tend to fall until sentiment reaches an extreme low. At the low, prices usually rebound BEFORE sentiment does. A rebound in prices will trigger a positive feedback loop of higher prices and higher sentiment. Sentiment is more precise at calling tops than bottoms.
DYNAMIC REFERENCE POINTS
Michael Lewis’ book “The Undoing Project” is an entertaining biography of the Daniel Kahneman - Amos Tversky partnership that transformed psychology and economics. Kahneman and Tversky’s breakthroughs include Prospect Theory and its constituents - cognitive frames of gain versus loss (framing) and the idea of the reference point. The reference point anchors our expectations and its dynamic nature is key to understanding market psychology.
In a simplification, if we expect market prices to rise from the current point, we are operating from the frame of losses (we are down relative to where we want to be). In the frame of losses people take excessive risk. Investors who have a reference point for market prices above the current level will be more inclined to buy (or at least not to sell) during downturns. Over the past decade investors have learned that buying on dips is a successful approach, and going into 2018 their reference point remained high.
Anecdotally, I’m still hearing from people “bottom fishing” in the current market, buying tech stocks that are back to their 2017 prices or loading up on Bitcoin since its descent to $3500. But that enthusiasm to “catch the falling knife” is worrisome to me. It indicates that investors’ reference point is higher than current level. Selloffs usually don’t end until the reference point falls and short term investors wash out.
If investors expect market prices to fall from their current level, then they are said to be in the domain of gains (current prices are above their expectations), and so they are more likely to sell to preserve their gains. During a bear market, investors gradually transition their reference points (expectations) from higher to lower. We will know we’re at a bottom when investors start selling “just to keep what I’ve got left” - that is, when their reference point falls to below the current level and their paper losses actually feel like gains because they are getting out with some cash (versus none).
It's only when fear rises enough to motivate mass selling that prices hit a V-bottom and reverse. However, sentiment can hit a low along with prices, bounce for a week or two (as we saw in November), and then rollover to hit lower lows. A series of sentiment lows, followed by price bounces, is common during bear markets.
The reference point (expectations) are dynamic, and they are contingent upon emotional state and stress level. This is a key to understanding an using Prospect Theory in financial markets - reference points change. Media sentiment reflects these shifts.
LOOKING FORWARD
How could I have accessed "emotivation" back in October? (And given the failure of market timing for most people, should I have even done so?) For me, the answer to these questions was inspired both by emotional agitation and an intellectual appreciation of what we're involved in. Timing is part and parcel of understanding and using sentiment data. Our sentiment tools give us a key advantage in the timing game. So while we won't be giving specific directional advice in newsletters - everyone is on their own journey and needs to make such decisions for themselves - as a firm we will be operationalizing and using sentiment-based timing tools in 2019.
What do we see going forward? (Please see the disclaimers below). As we noted back in October's newsletter, if liquidity drove the U.S. stock market up since 2009, then lack of liquidity (higher interest rates and deleveraging by the Fed) will drive it down. Compound that with geopolitical, governance, and trade uncertainty, and there are no compelling reasons for the market to rebound in the near term except for one - extremely negative sentiment this week may lead to a short term bounce.
With the current challenging environment, it's important to stay balanced (and yet on our toes!).
HOUSEKEEPING AND CLOSING
After our last newsletter, several readers asked why I moved to Bali. There are many reasons: My wife and I enjoy traveling, yoga (Bali is a yoga hub), and new experiences. We imagined it would be great for our three children to get out of the Western bubble (it was!). Professionally I can work anywhere, a large portion of our data business is in Asia, and we’re expanding our Singapore office. Of course there are a few drawbacks to living in Indonesia (poor air quality, substandard infrastructure, occasional infectious diseases), but so far the pluses outweigh the minuses.
The above research is derived using our Thomson Reuters / Refinitiv MarketPsych Indices (TRMI). The TRMI measure and deliver real-time market psychology and macroeconomic trends from thousands of news and social media sites. If you're an academic interested in data for research, please reach out for access. If you represent an institution, please contact us. The commercial Thomson Reuters MarketPsych Indices dataset includes granular themes and sentiments for 45 currencies, 62 sovereign bonds and stock indexes, 12,000+ companies and stocks, 36 commodities, 187 countries, and 150+ cryptocurrencies.
In closing, we wish you health, peace, and prosperity in 2019!
Below is a photo of our amazing Singapore/Bali team (from left: Jane, Giang, CJ, Eugene, Zhao, Ilia, Richard, Alex).
Happy Holidays!
Richard Peterson and the MarketPsych Data Team
REFERENCES
1. Smith, A., Lohrenz, T., King, J., Montague, P. R., & Camerer, C. F. (2014). Irrational exuberance and neural crash warning signals during endogenous experimental market bubbles. Proceedings of the National Academy of Sciences, 111(29), 10503-10508.
2. Newell, A., & Page, L. (2017). Countercyclical risk aversion and self-reinforcing feedback loops in experimental asset markets (No. 050). QUT Business School.